Agents Performance Analytics
This guide provides an overview of the Agent Performance Analytics section, helping you understand how to interpret the data, evaluate agent performance, and gain insights from various visualizations and metrics.
Filter Options
At the top of the page, you can filter the data by:
- Date range:
Info: All data will be shown from 16th May, 2025, and after this date, all data before will not be available in the conversations analytics page.
These filters update all insights and charts below based on your selection.
1. Insight Cards Overview

Located at the top of the analytics page, these cards provide a quick snapshot of key performance indicators:
- Average Response Time
Displays the average time taken by agents (humans only) to send their first reply in conversations assigned to them.
(Based on the selected date range and agent)
- Average Resolution Time
Reflects the average time taken to resolve (close) assigned conversations.
(Only includes resolved conversations within the selected date range)
- Average SLA Compliance
Percentage of conversations that met Service Level Agreement (SLA) targets in SLA-enabled inboxes.
(Based on the selected date range and agent)
- Assigned Conversations
The total number of conversations that were assigned to the selected agent(s) during the specified timeframe.
(Based on the selected date range and agent)
- Reassigned Conversations
Shows how many conversations were transferred from or to the selected agent(s).
(Based on the selected date range and agent)
- Average Sentiment Score
Indicates the average customer sentiment score from closed conversations handled by the agent(s).
(Based on the selected date range and agent)
Total Number of Conversations Table
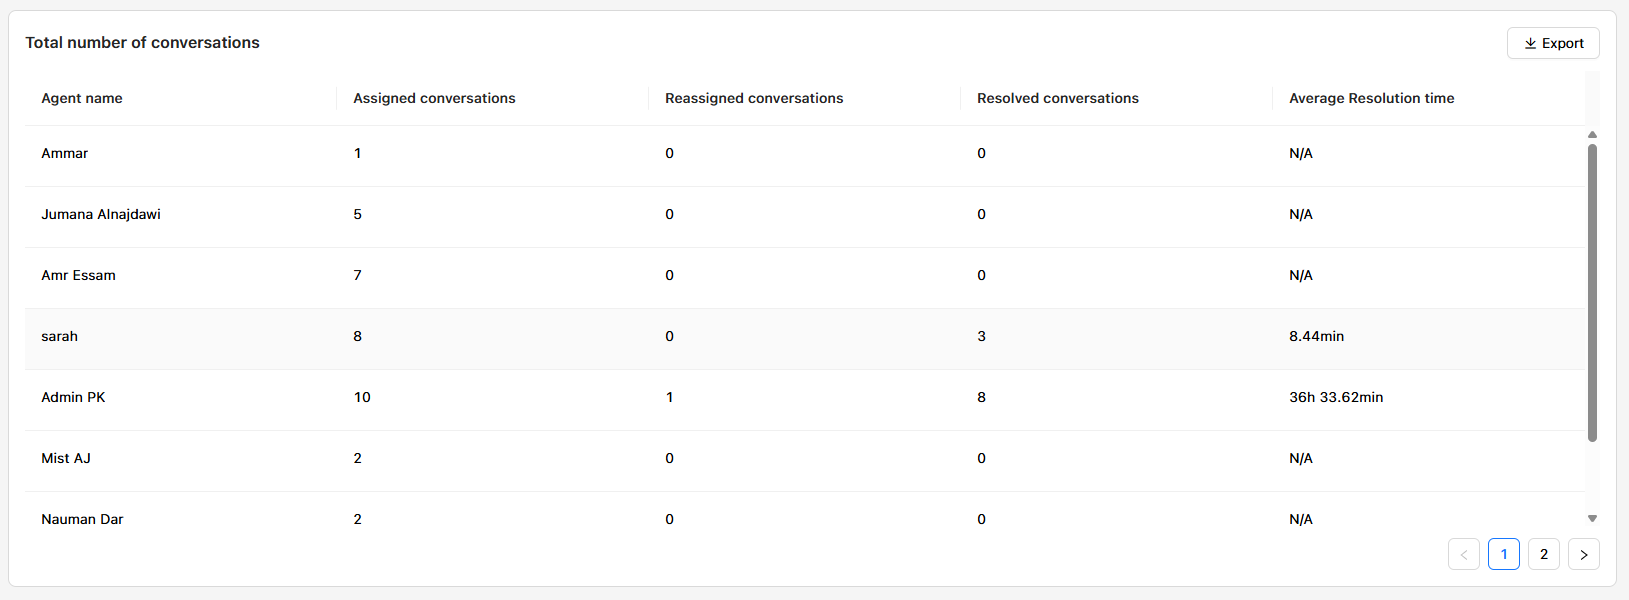
This section provides a detailed breakdown of agent activities during the selected period:
| Column | Description |
|---|---|
| Agent Name | Lists the agents being evaluated. |
| Assigned Conversations | Conversations first assigned to the agent. |
| Reassigned Conversations | Conversations transferred to the agent. |
| Resolved Conversations | Number of conversations the agent closed/resolved. |
| Average Resolution Time | Time taken by the agent to resolve their assigned conversations. |
Use this table to assess workload distribution and agent productivity.
Response Metrics Overview Table
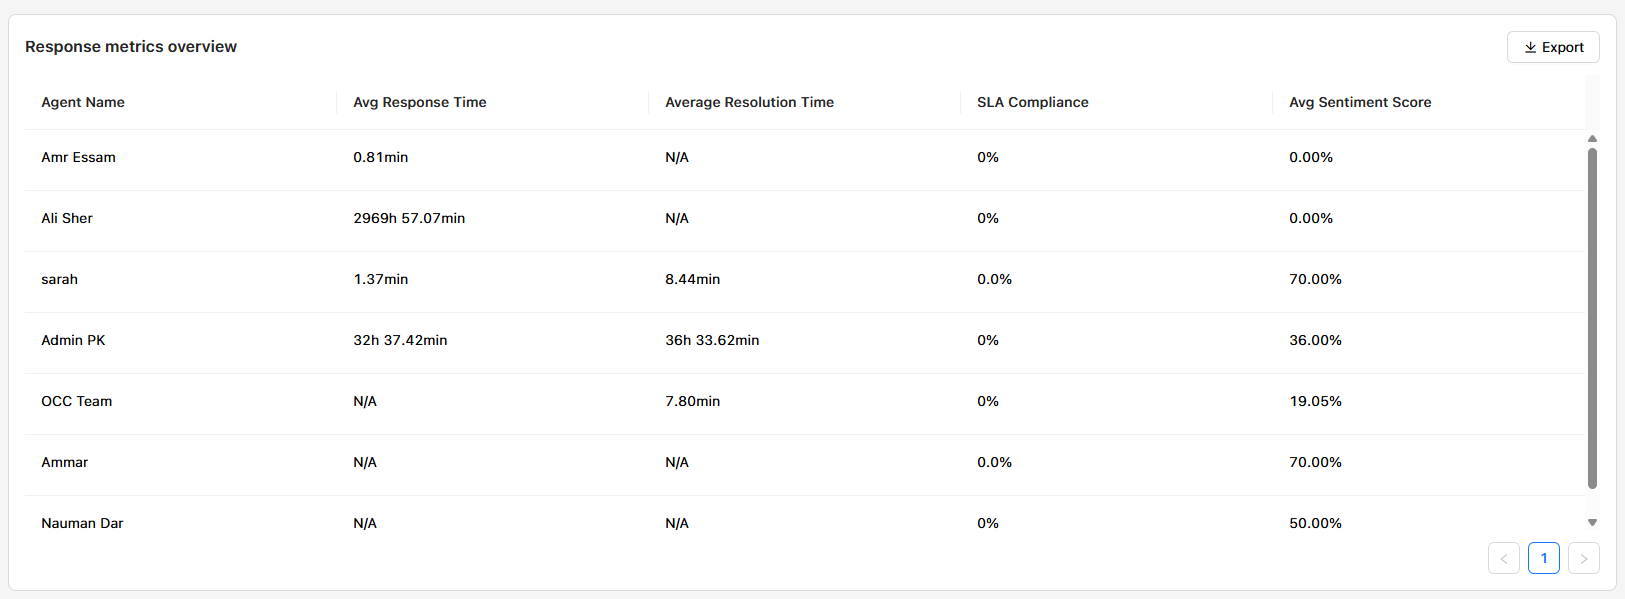
This table offers deeper insight into agent efficiency and performance:
| Column | Description |
|---|---|
| Agent Name | Lists the agents being evaluated. |
| Average Response Time | Time taken to send the first response in assigned conversations. |
| Average Resolution Time | Time taken for the agent in the conversations until closed out of all that were opened. |
| Average Handling Time | Average time between conversation opening and closing. |
| SLA Compliance | Percentage of closed conversations meeting SLA targets. |
| Average Sentiment Score | Average sentiment rating from customers on closed conversations. |
This table is ideal for identifying performance gaps or outstanding contributors.
Volume Trends Heatmap Chart
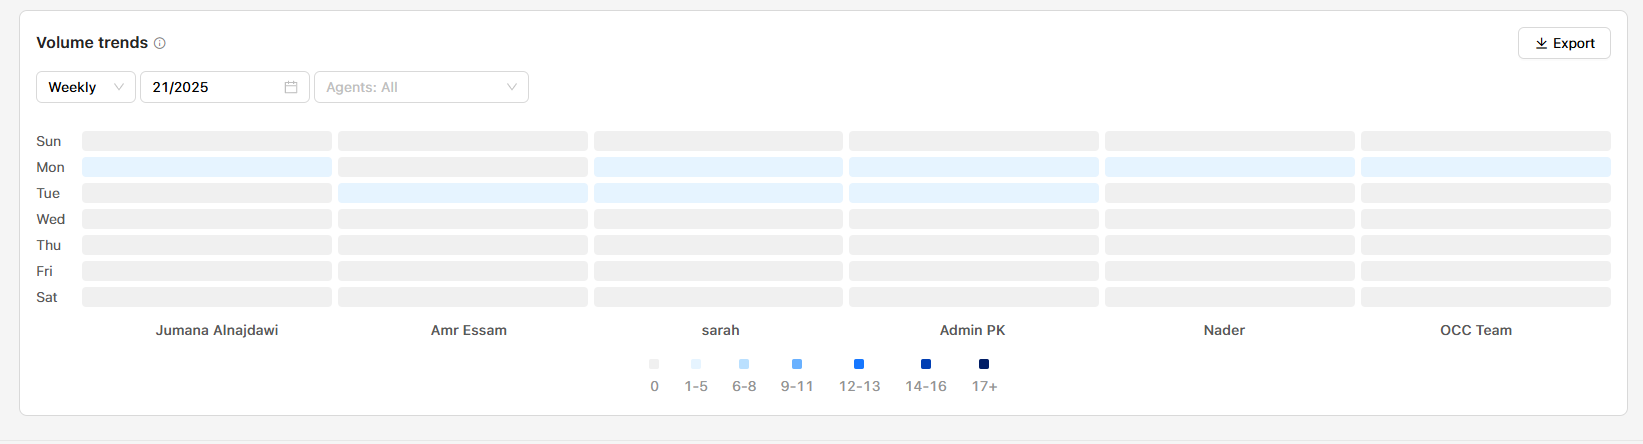
A visual heatmap that shows volume of conversations per agent across different days of the week.
- Daily View: Select a day to see how conversation volume varies hourly.
- Weekly View: Select a week to see how conversation volume varies daily.
- Agent Filter: Choose specific agents to narrow your analysis.
Use Cases:
- Identify peak activity days/hours.
- Understand individual agent workload trends.
- Adjust shift scheduling and staffing accordingly.
Tips for Use
- Always select the appropriate date range and agent filters to ensure relevant data.
- Use the Export button to download data tables for further analysis or reporting.
- Monitor SLA Compliance and Sentiment Score regularly for quality assurance and training opportunities.
Updated about 1 year ago