Requests and Labels
The Requests and Labels analytics page helps you track and understand how incoming support requests are handled and categorized across different agents, channels, and periods. Here's a breakdown of the available data visualizations and what they represent:
Insight Cards
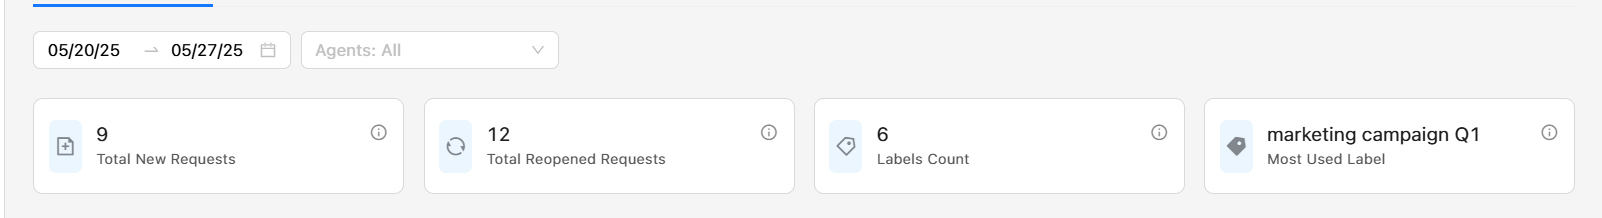
At the top of the page, you’ll find four insight cards providing quick-glance statistics:
- Total New Requests
Shows the number of newly created requests within the selected date range. You can filter this data by specific agents to narrow down the view. - Total Reopened Requests
Displays the number of requests that were reopened within the selected date range. Reopened requests indicate cases that required further follow-up after initial closure. - Total Unique Labels
This represents how many distinct labels were used in the system during the selected time range. It gives an idea of the diversity and depth of request categorization by the assigned labels. - Most Used Label
Highlights the label that was applied to the highest number of requests in the filtered period. This helps identify common issues or themes in customer queries.
Bar Chart – Requests by Inbox
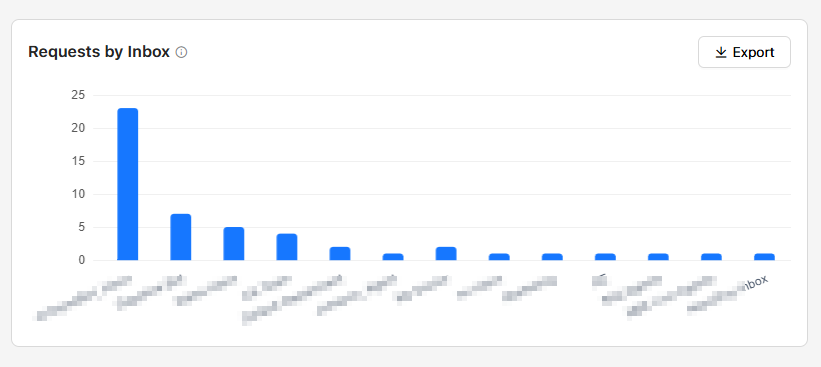
This bar chart visualizes the distribution of requests across different inboxes per the filtered agent. Each bar represents a specific inbox and shows how many requests it received, based on the selected date range, channels, and agents.
Use this chart to:
- Identify which inboxes are handling the most volume.
- Monitor workload distribution across agents.
Pie Chart – Label Distribution
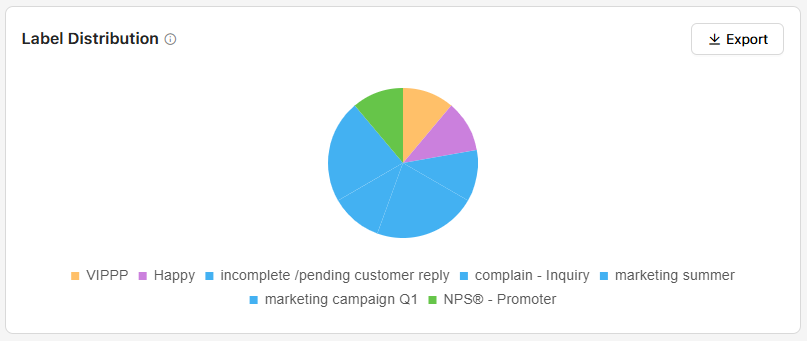
This pie chart provides a visual breakdown of labels used in the selected time frame. Each slice of the pie represents a different label, with the size indicating its usage proportion.
Use this chart to:
- Quickly see the most and least used labels.
- Understand common request topics or issues.
- Assess labeling consistency across the team.
Conversations Journey Details Table
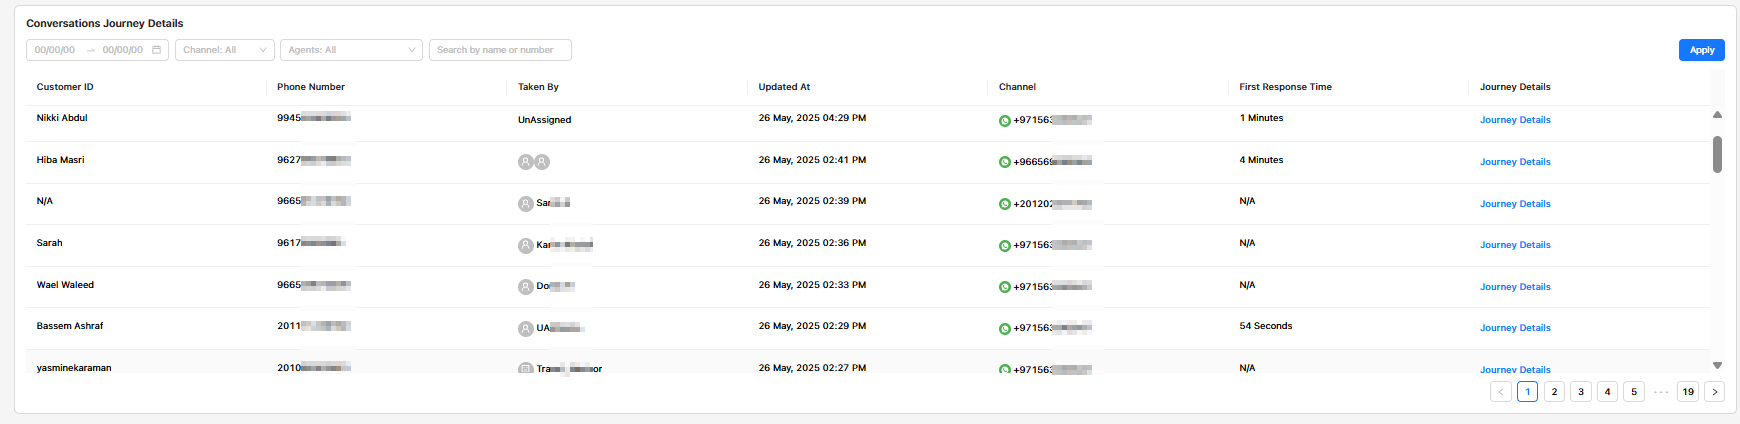
This detailed table gives a request-level view of individual conversations. It is useful for tracking customer journeys and evaluating how requests were handled.
Table Columns:
- Customer ID: The name or identifier of the customer (if available).
- Phone Number: The customer's contact number.
- Taken By: The agent or team who handled the request. Displays “Unassigned” if no agent has taken the request.
- Updated At: The last updated timestamp for the request.
- Channel: The messaging platform (e.g., WhatsApp) and contact number used.
- First Response Time: How quickly the first response was sent to the customer (e.g., "1 Minute", "54 Seconds").
- Journey Details: A clickable link that opens the full interaction history for that customer.
Filters available at the top of the table:
- Date Range
- Channel
- Agent
- Search by Name or Number
Use this table to:
- Investigate specific cases.
- Monitor first response times.
- Identify unassigned or delayed responses.
- Access full journey history for quality checks or coaching.
Updated about 1 year ago