Conversations Analytics
The Conversations Analytics page provides a comprehensive overview of how conversations are being handled across channels, agents, and bots. This section helps supervisors and managers monitor performance, sentiment, message load, and SLA compliance in real-time or across a selected period.
Filter Options
At the top of the page, you can filter the data by:
- Date range:
Info: All data will be shown from 9th May, 2025, and after this date, all data before will not be available in the conversations analytics page.
- Agents: listing of all human agents in the system.
These filters update all insights and charts below based on your selection.
Insight Cards
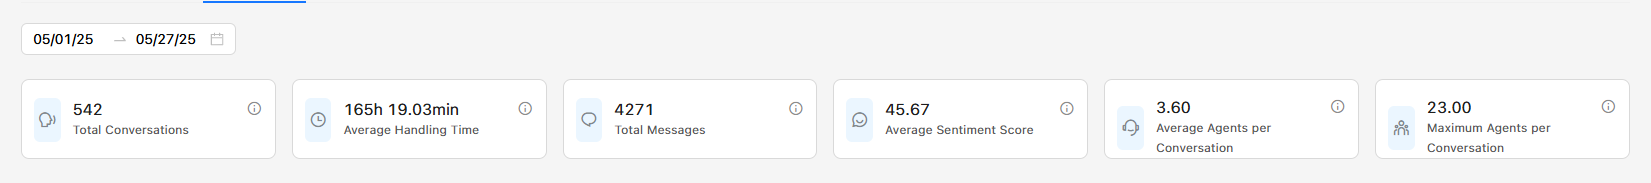
These cards summarize key performance metrics for the selected period:
-
Total Conversations
Shows the number of all conversations created, including open, closed, assigned, and unassigned. -
Average Handling Time
Represents the average time taken to handle conversations from creation to closure. -
Total Messages
The total number of messages exchanged in all closed conversations. -
Average Sentiment Score
The average sentiment value (from 0 to 100) of closed conversations, based on customer message tone. -
Average Agents per Conversation
How many agents (bots or humans), on average, participated in each conversation. -
Maximum Agents per Conversation
The highest number of agents (bots or humans) that participated in a single conversation.
Pie Charts and Visual Metrics
- Conversations Handled
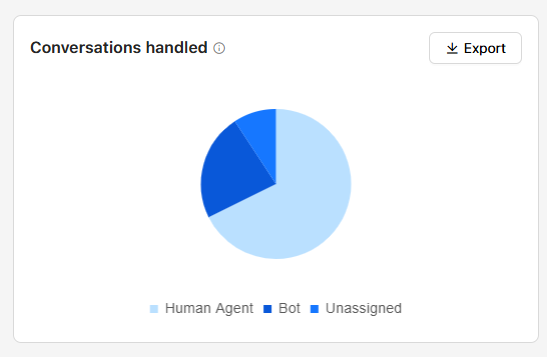
Breaks down how conversations were managed:
- Human Agent
- Bot
- Unassigned
- Messages per Conversation
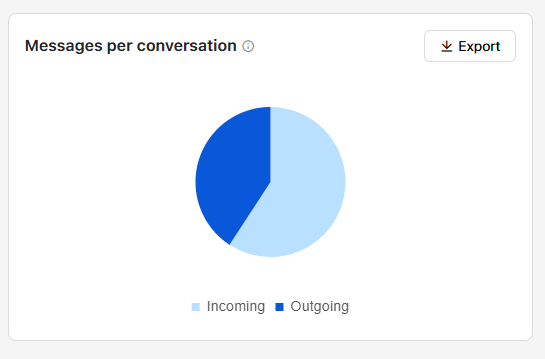
Shows the ratio of incoming vs. outgoing messages, helping assess workload balance.
The count for the messages will be counted once the conversation is closed.
- SLA Performance Breakdown
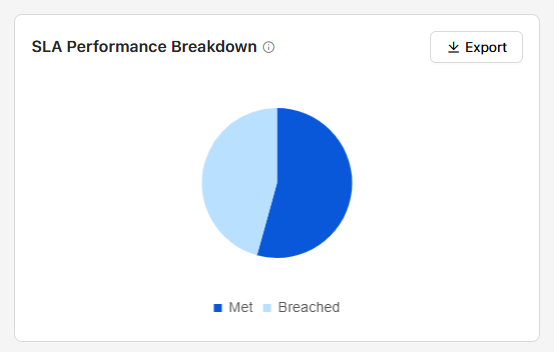
Displays the percentage of conversations that met or breached SLA targets, across inboxes where SLA is enabled.
Bar Charts
- Conversation Resolution Time
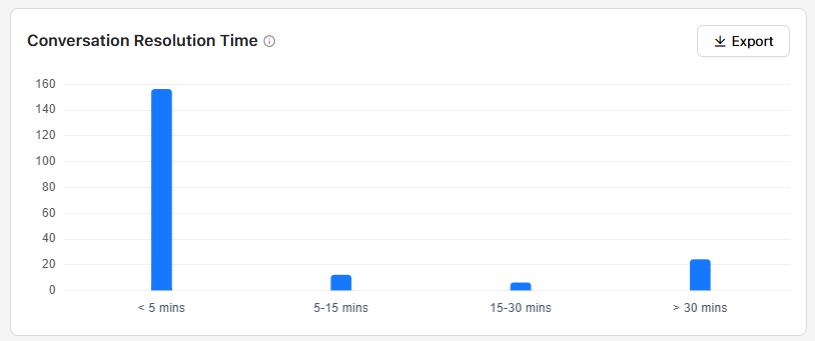
Visualizes how quickly conversations are resolved:
- < 5 mins
- 5–15 mins
- 15–30 mins
- 30 mins
- Sentiment Distribution
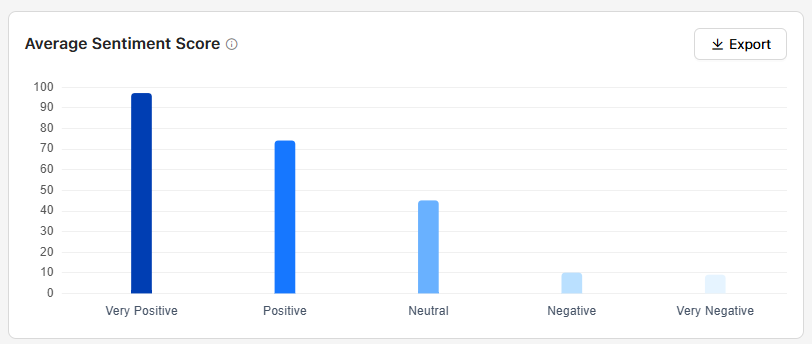
Categorizes closed conversations by sentiment as determined using our AI tools:
- Very Negative (0–19)
- Negative (20–39)
- Neutral (40–59)
- Positive (60–79)
- Very Positive (80–100)
Channel Performance Metrics Table
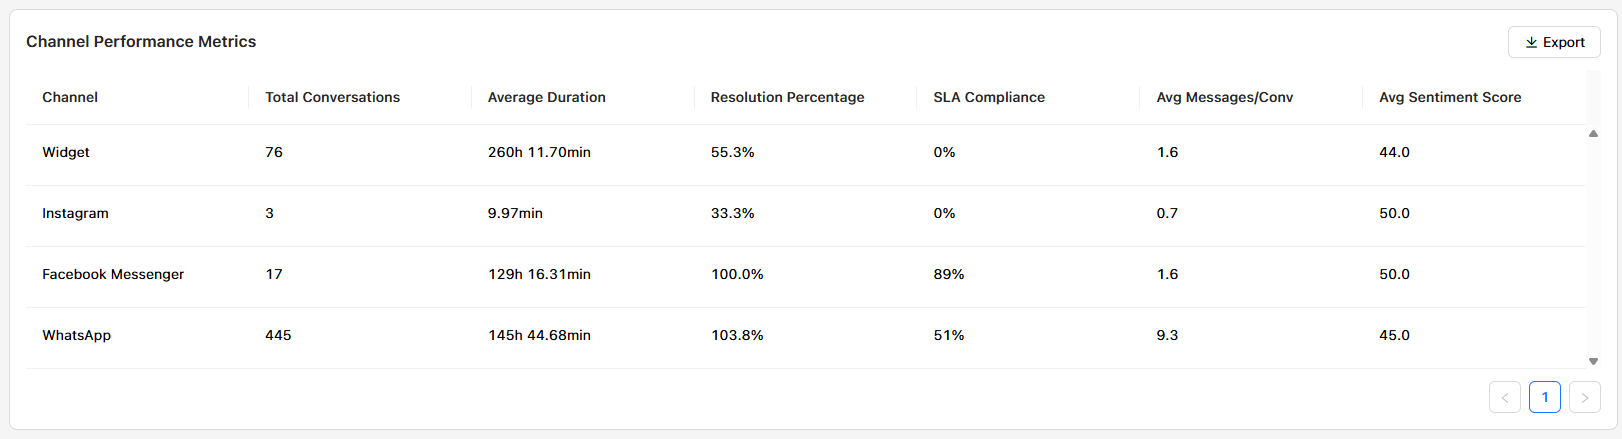
A detailed view per channel, including:
- Channel: The channel has any conversation traffic in the project.
- Total Conversations: Number of conversations created per channel.
- Average Duration: Average time from start to end of a conversation.
- Resolution Percentage: Percentage of conversations that were resolved.
- SLA Compliance: Percentage that met SLA over the inboxes that have the SLA feature configured.
- Avg Messages per Conversation: Average messages for the closed conversations per channel.
- Average Sentiment Score: Quality of conversation tone per channel as determined using our AI tools.
- The Sentiment score ranges:
- Very Negative (0–19)
- Negative (20–39)
- Neutral (40–59)
- Positive (60–79)
- Very Positive (80–100)
- The Sentiment score ranges:
Conversations by Hour Heatmap
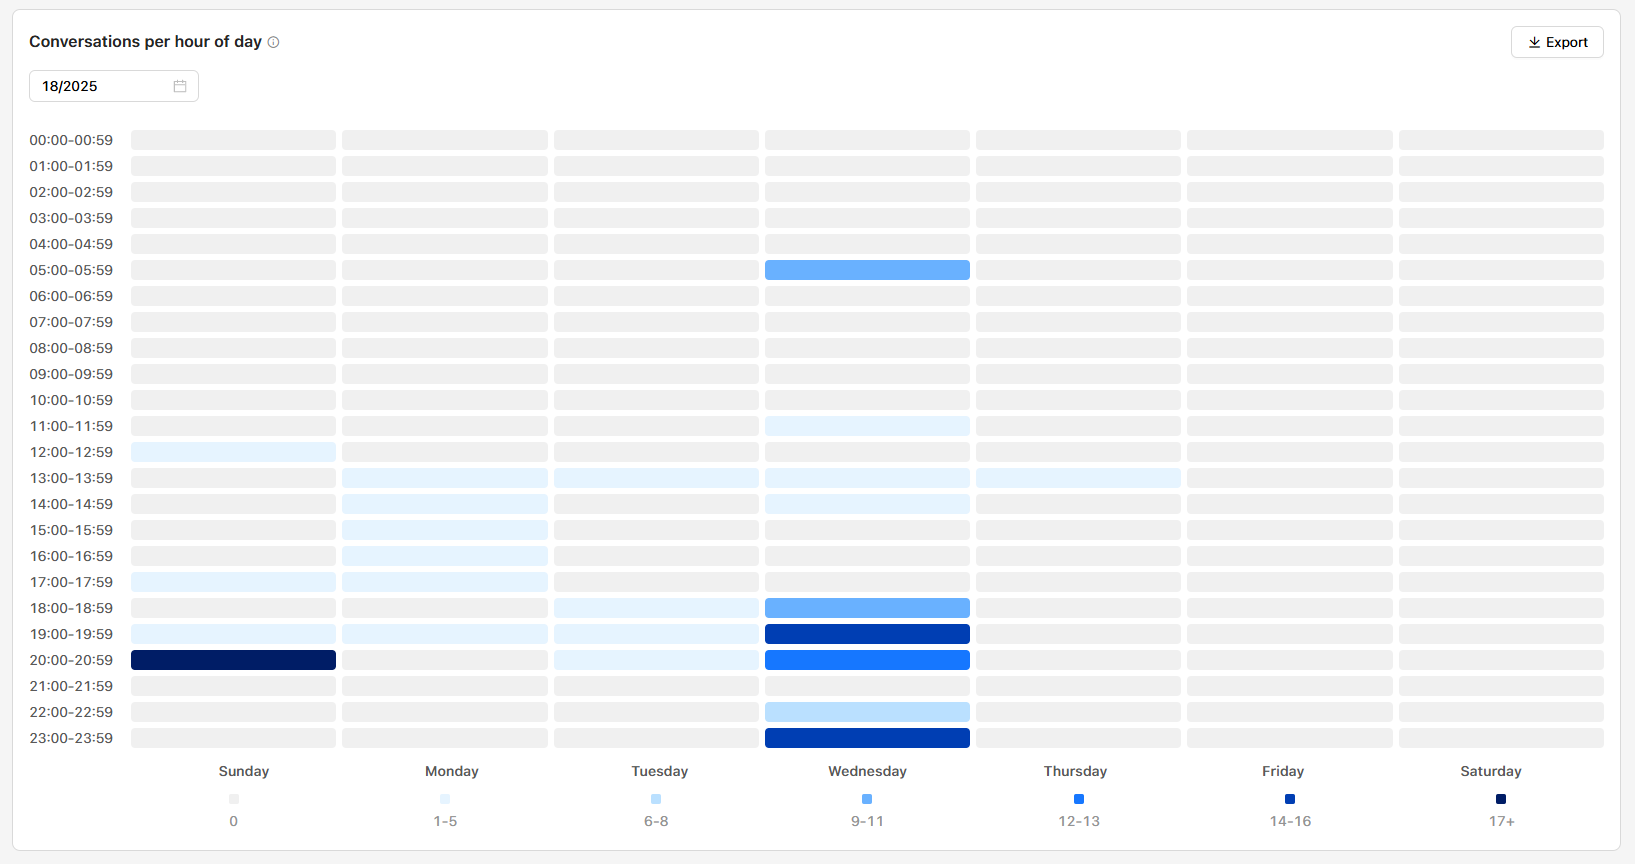
This heatmap shows peak hours by displaying the number of conversations created per hour throughout the selected week. Use this to identify high-traffic times and plan agent staffing accordingly.
As each color will represent the conversation count per hour within 7 ranges:
- Zero opened conversations
- 1-5 opened conversations
- 6-8 opened conversations
- 9-11 opened conversations
- 12-13 opened conversations
- 14-16 opened conversations
- 17+ opened conversations
Ensuring that the system checks the count of open conversations by the end of each hour of the day.
Updated about 1 year ago